2023–24 results
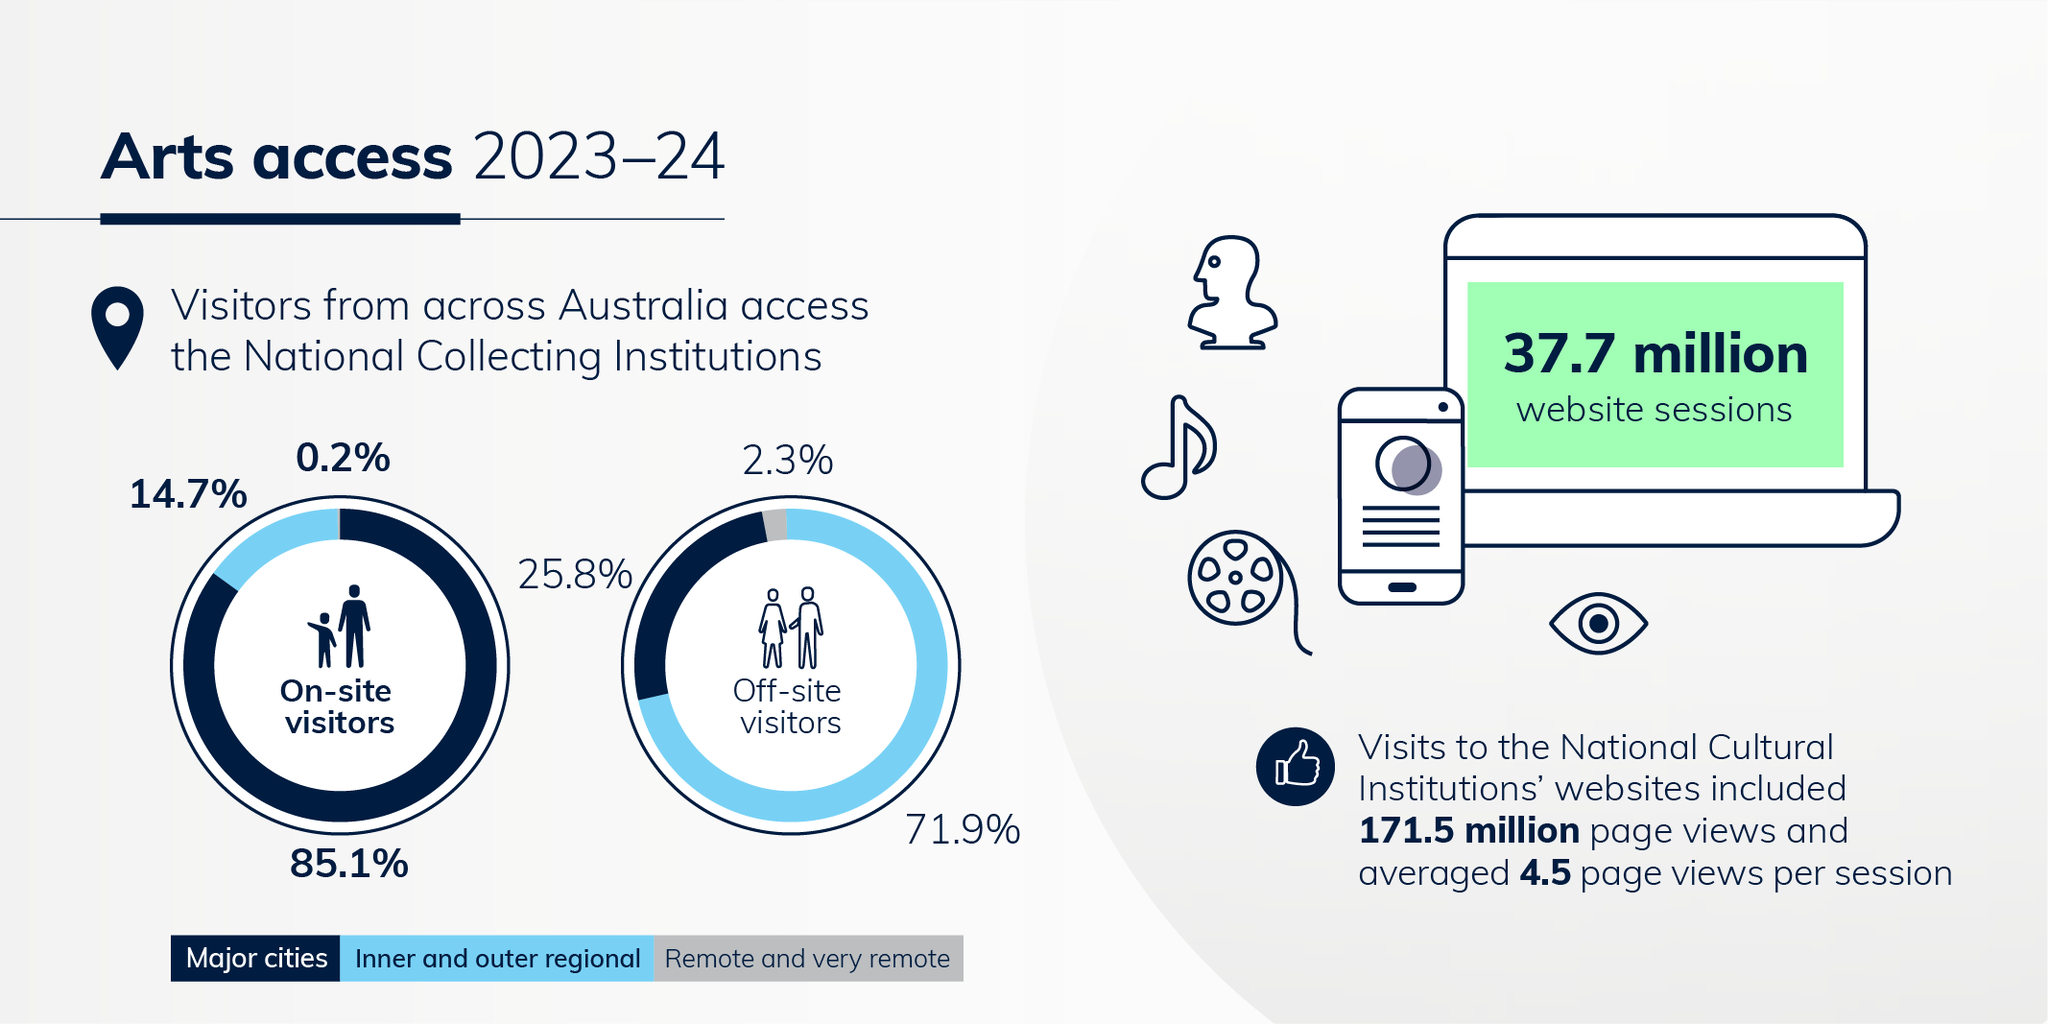
- Two donut charts are used to depict percentages of visitors from across Australia accessing the National Collecting Institutions.
- On-site visitors included, 85.1% from major cities, 14.7% from inner and outer regional areas, and 0.2% from remote and very remote areas.
- Off-site visitors included, 25.8% from major cities, 71.9% from inner and outer regional areas, and 2.3% remote and very remote areas.
- The text '37.7 million website sessions' is shown within a line drawn image of a computer screen.
- An image of a thumbs up icon has accompanying text which reads, 'Visits to the National Cultural Institutions' websites included 171.5 million page-views and averaged 4.5 page-views per session'.
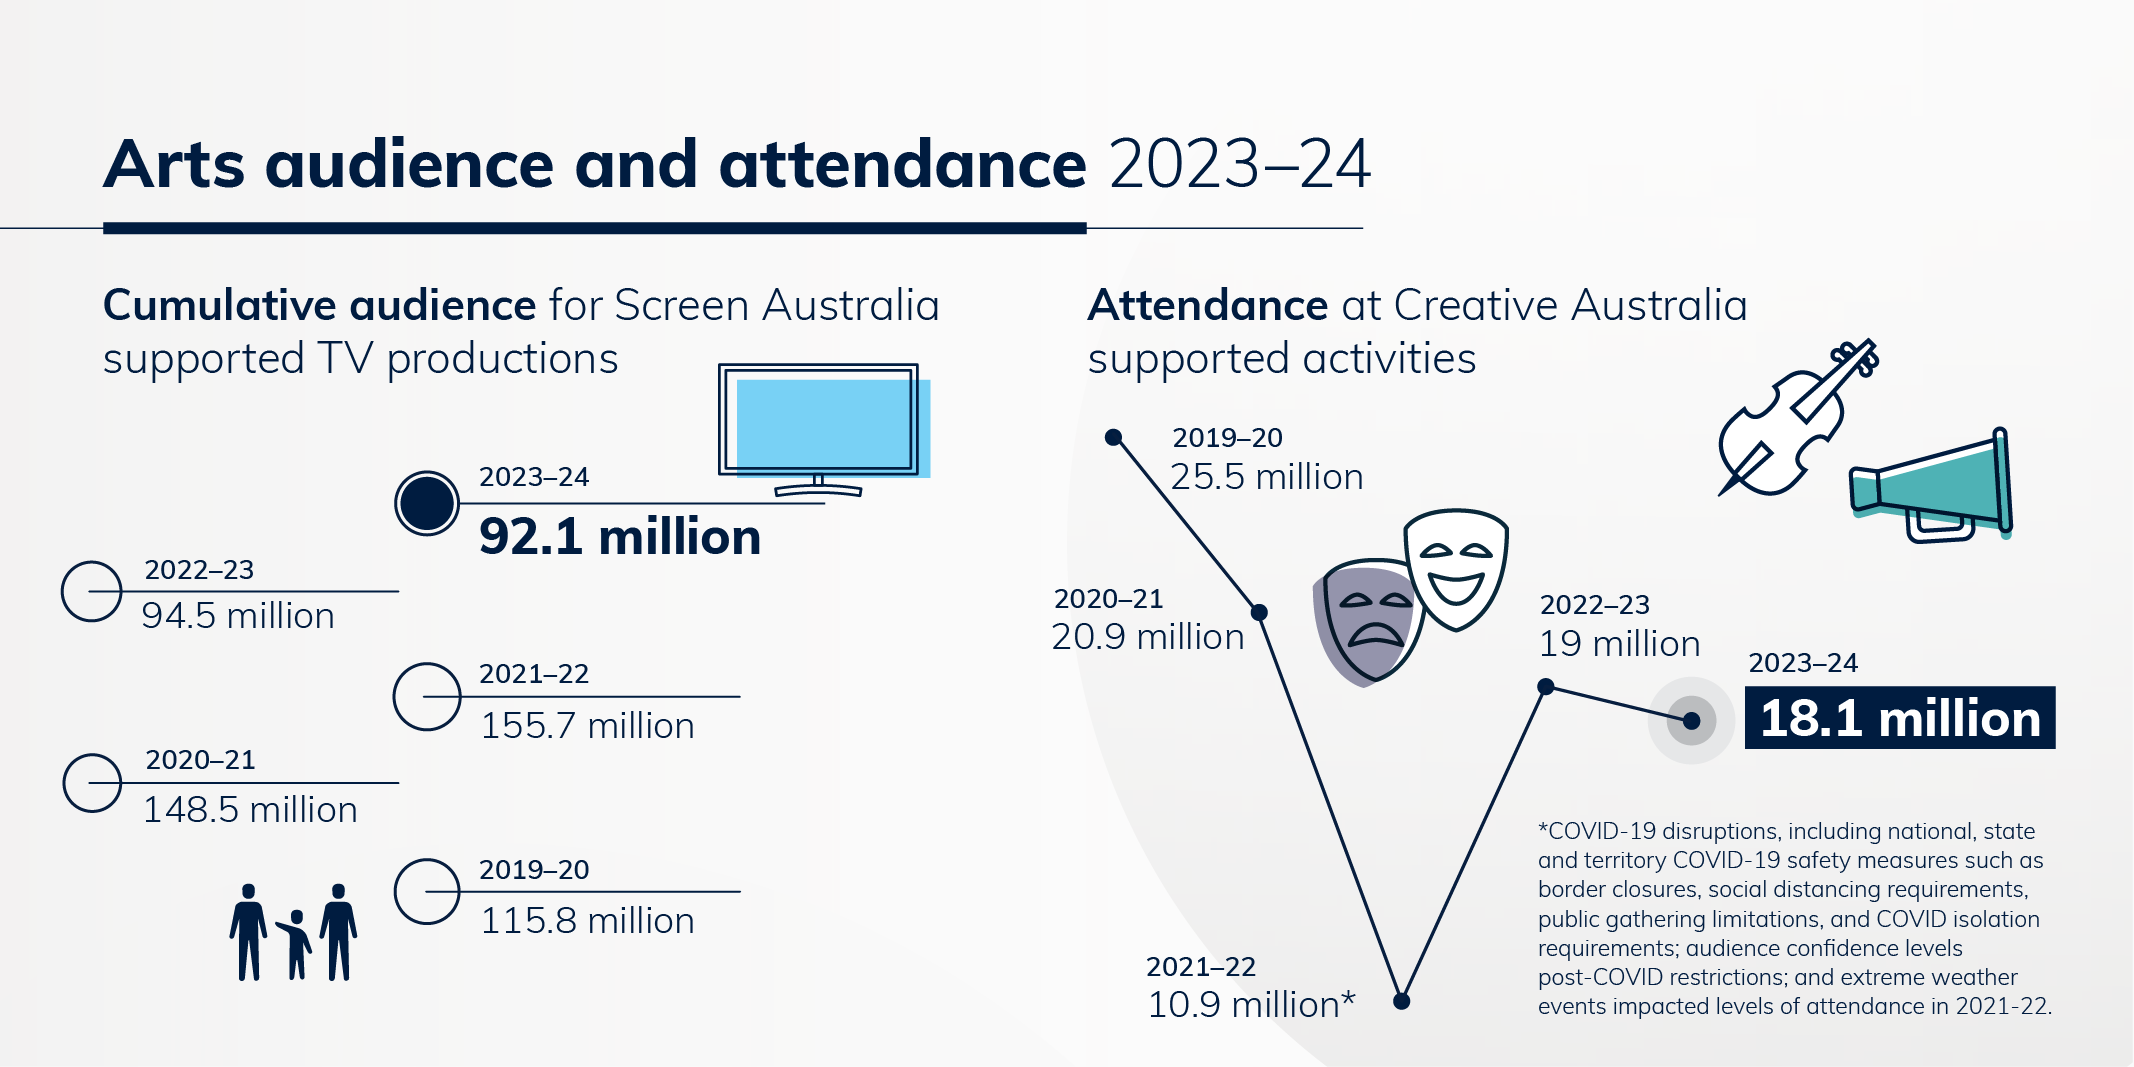
- A line drawing of a TV and people and text listing the annual cumulative audience of Screen Australia supported TV productions over five years.
- 2023–24—92.1 million
- 2022–23—94.5 million
- 2021–22—155.7 million
- 2022–23—148.5 million
- 2019–20—115.8 million.
- A line graph depicting annual attendance at Creative Australia supported activities over five years, including line drawings of a violin, megaphone and theatre masks.
- 2019–20—25.5 million
- 2020–21—20.9 million
- 2021–22—10.9 million
- 2022–23—19 million
- 2023–24—18.1 million.
- The 2021–22 figure includes an additional note which states 'COVID-19 disruptions, including national, state and territory COVID-19 safety measures such as border closures, social distancing requirements, public gathering limitations, and COVID isolation requirements; audience confidence levels post-COVID restrictions; and extreme weather events impacted levels of attendance in 2021–22.'.
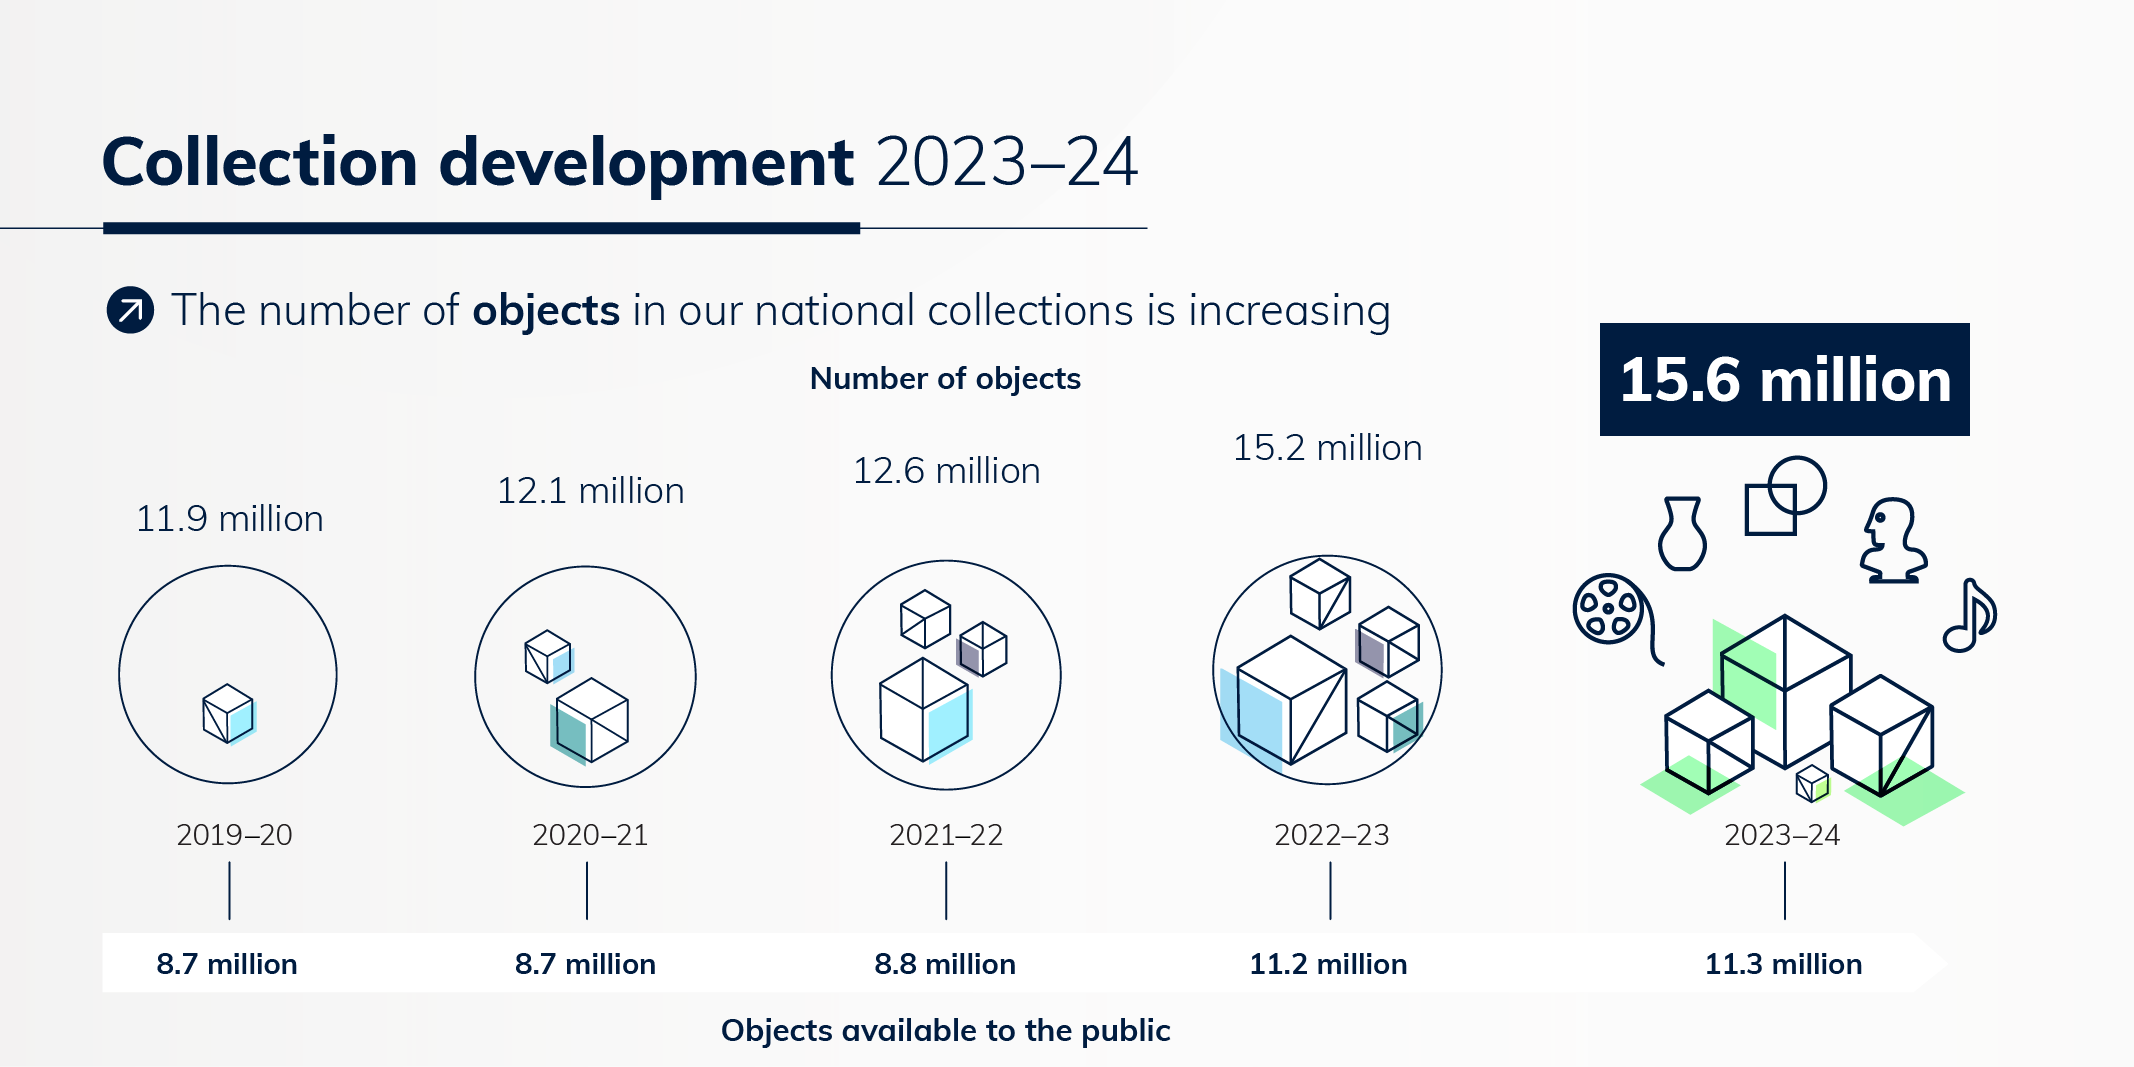
- A line drawing of an increasing number of cubes representing how the annual number of objects in our national collections is increasing
- 2019–20—11.9 million objects in the national collection and 8.7 million objects available to the public
- 2020–21—12.1 million objects in the national collection and 8.7 million objects available to the public
- 2021–22—12.6 million objects in the national collection and 8.8 million objects available to the public
- 2022–23—15.2 million objects in the national collection and 8.7 million objects available to the public
- 2023–24—15.6 million objects in the national collection and 11.3 million objects available to the public.
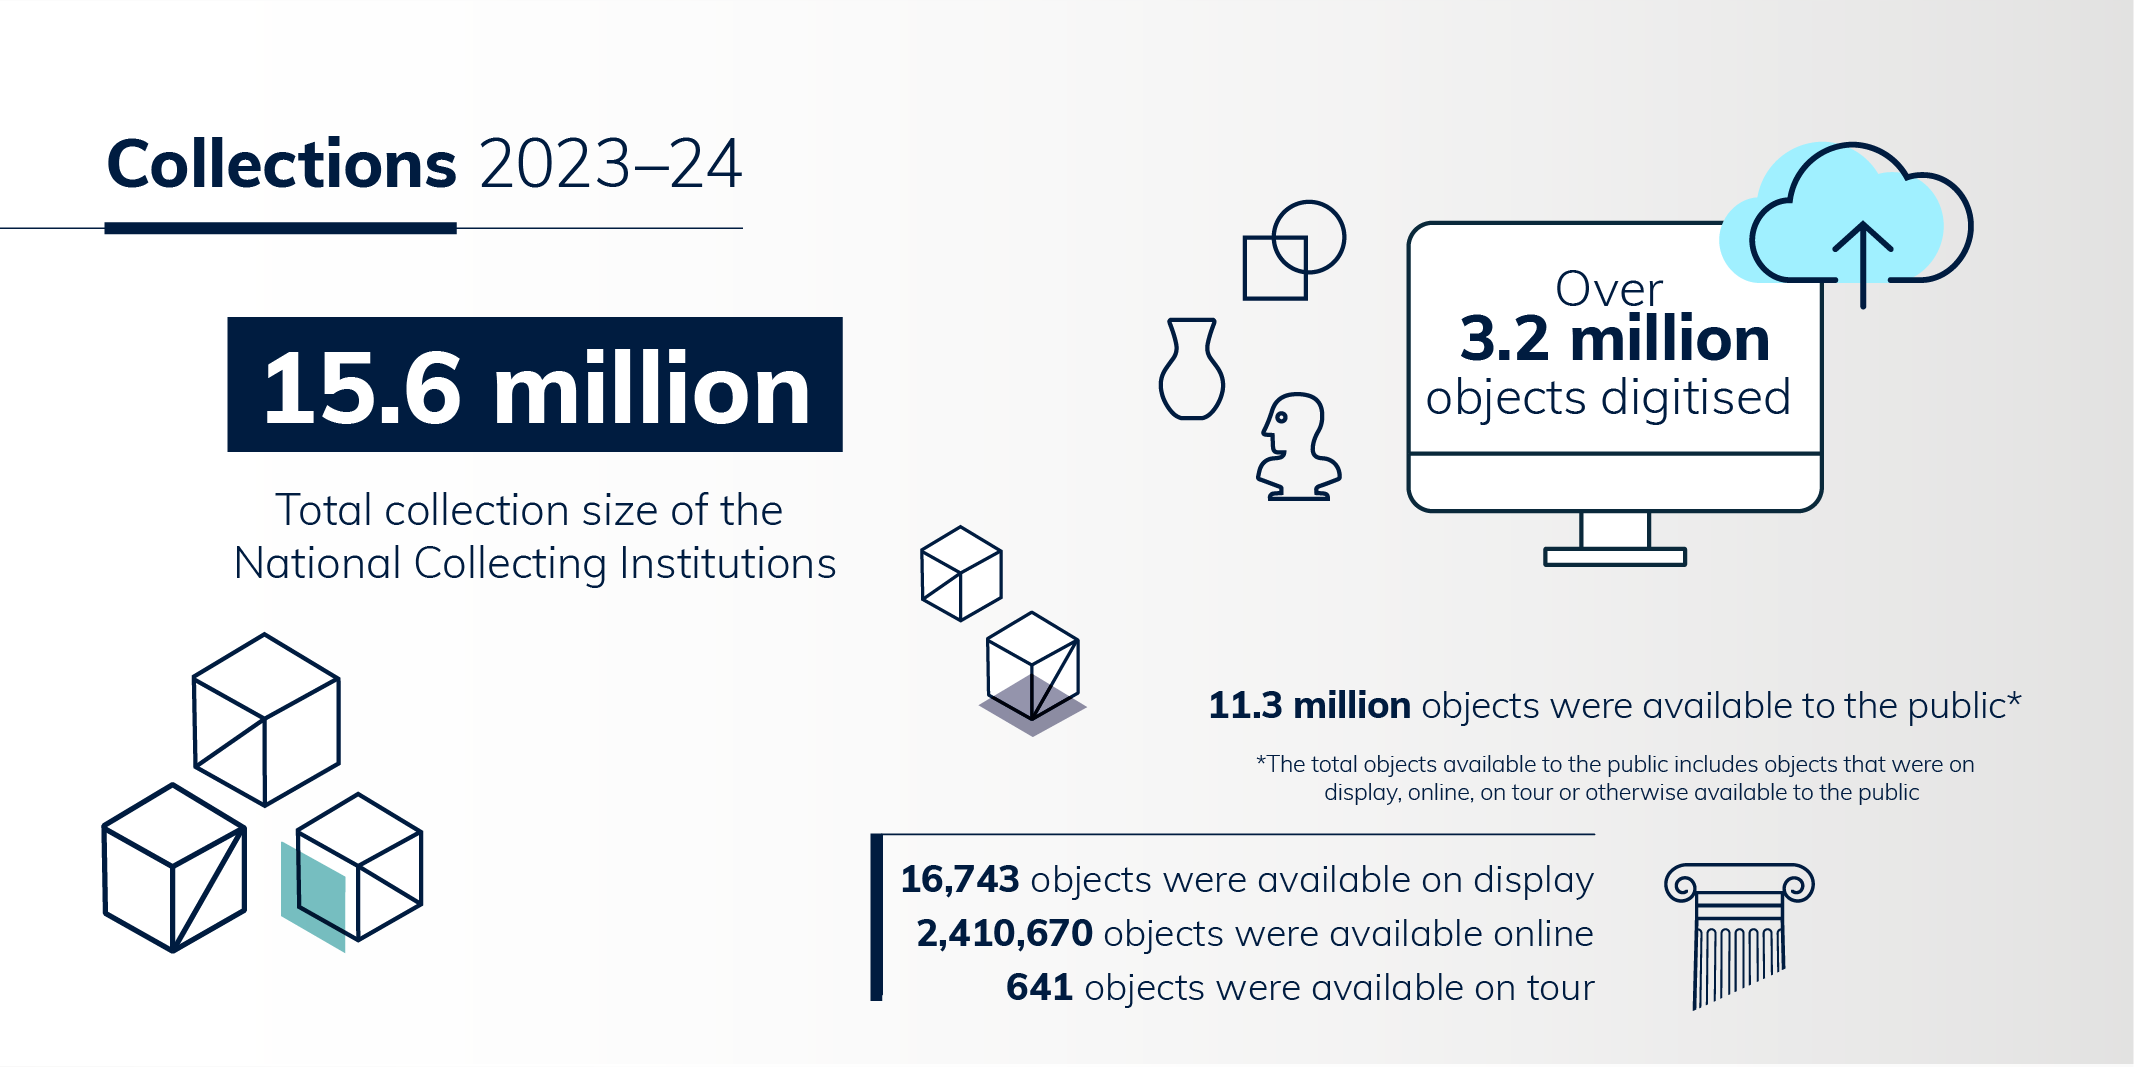
- Line drawing of five cubes and text '15.6 million total collection size of the National Collecting Institutions'.
- Text inside an image of a computer screen and the text 'Over 3.2 million objects digitised'.
- Text '11.3 million objects were available to the public' and an additional note which states that the total objects available to the public includes objects that were on display, online, on tour, or otherwise available to the public.
- Text '16,743 objects were available on display'.
- Text '2,410,670 objects were available online'.
- Text '641 objects were available on tour'.
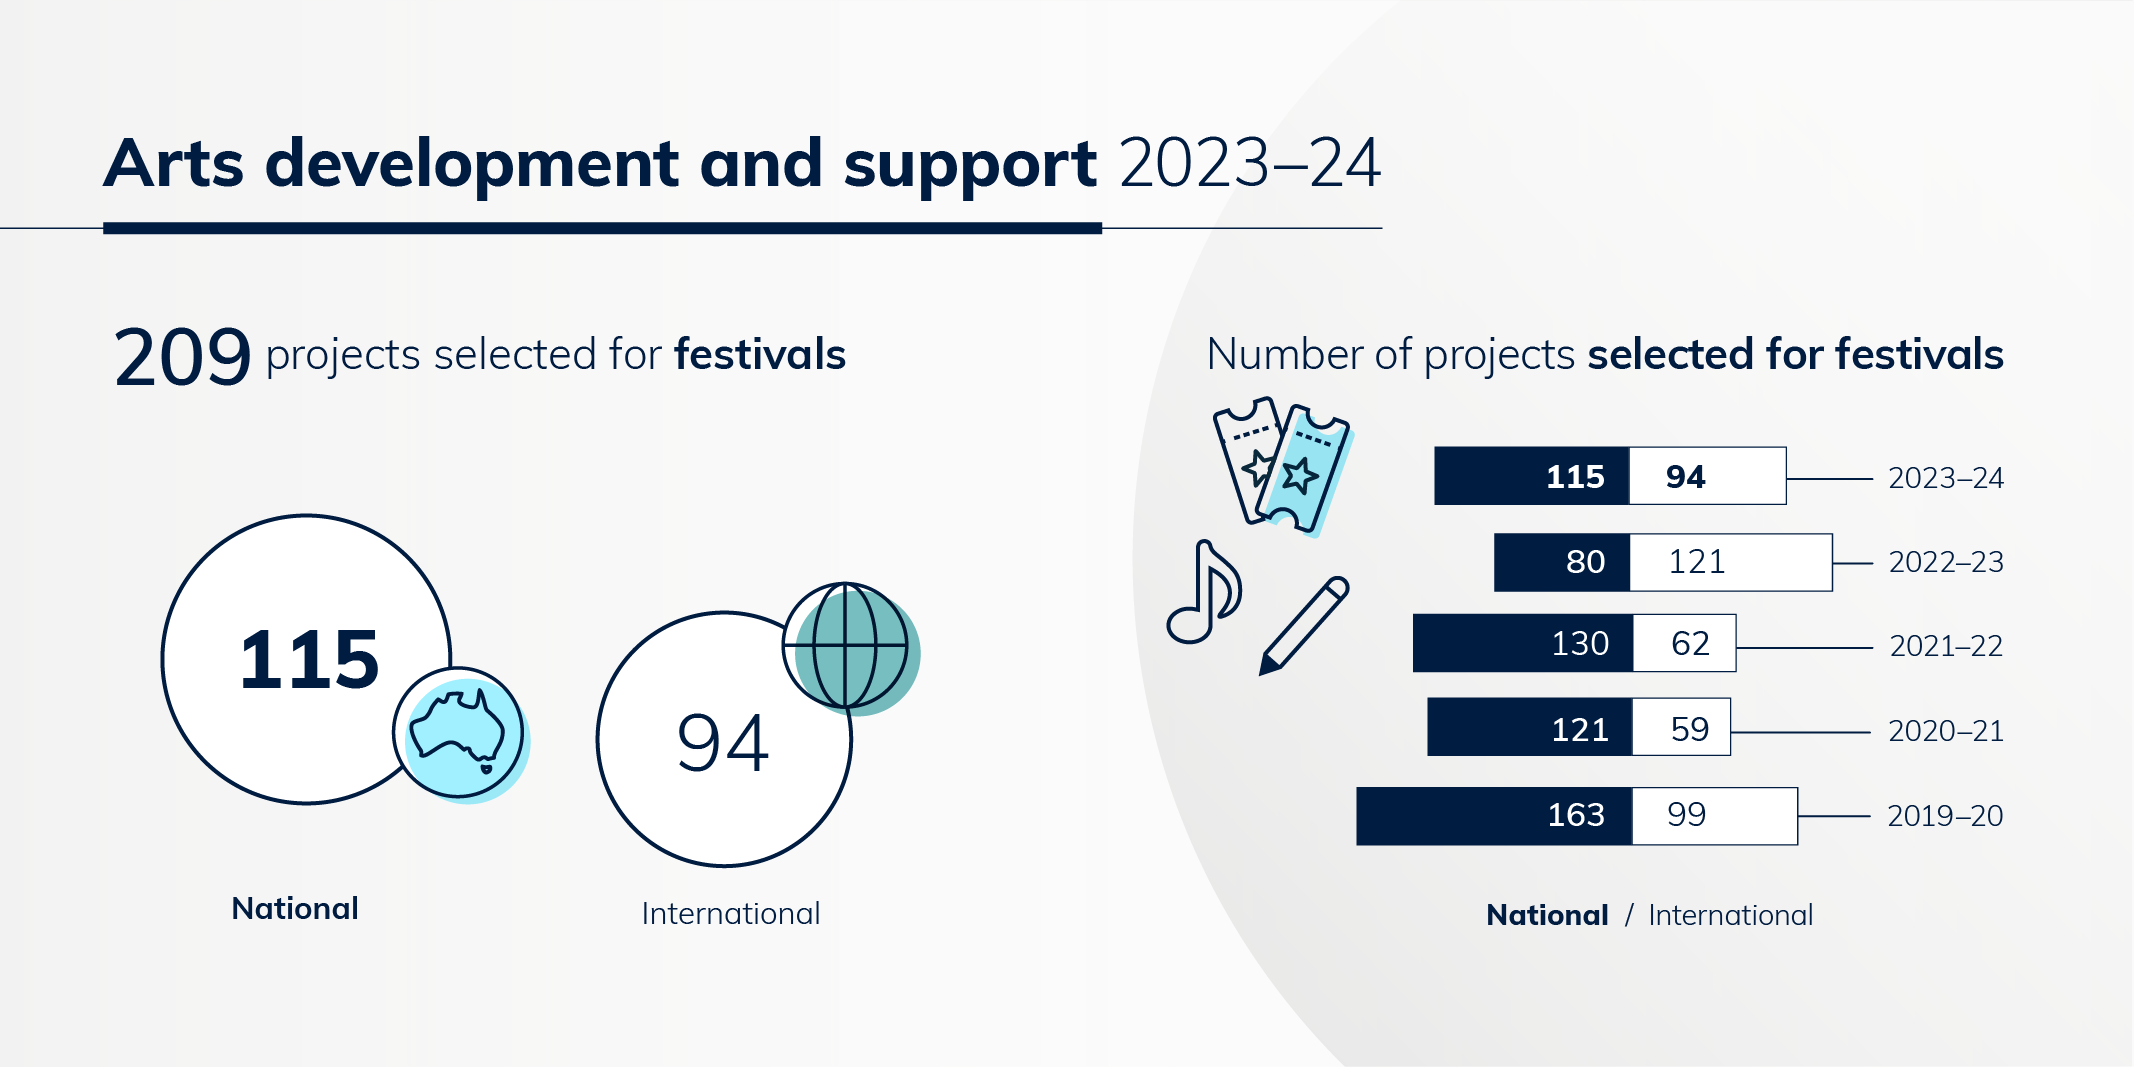
- Line drawing depicting 209 projects selected for festivals. Drawing uses an icon of representation of Australia for national projects and a globe for international projects.
- 115 national (line drawing of a map of Australia)
- 94 international (line drawing of a globe).
- A bar graph depicts the number of projects selected for festivals over five years
- 2019-20—163 national and 99 international
- 2020-21—121 national and 59 international
- 2021-22—130 national and 62 international
- 2022-23—80 national and 121 international
- 2023-24—115 national and 94 international.
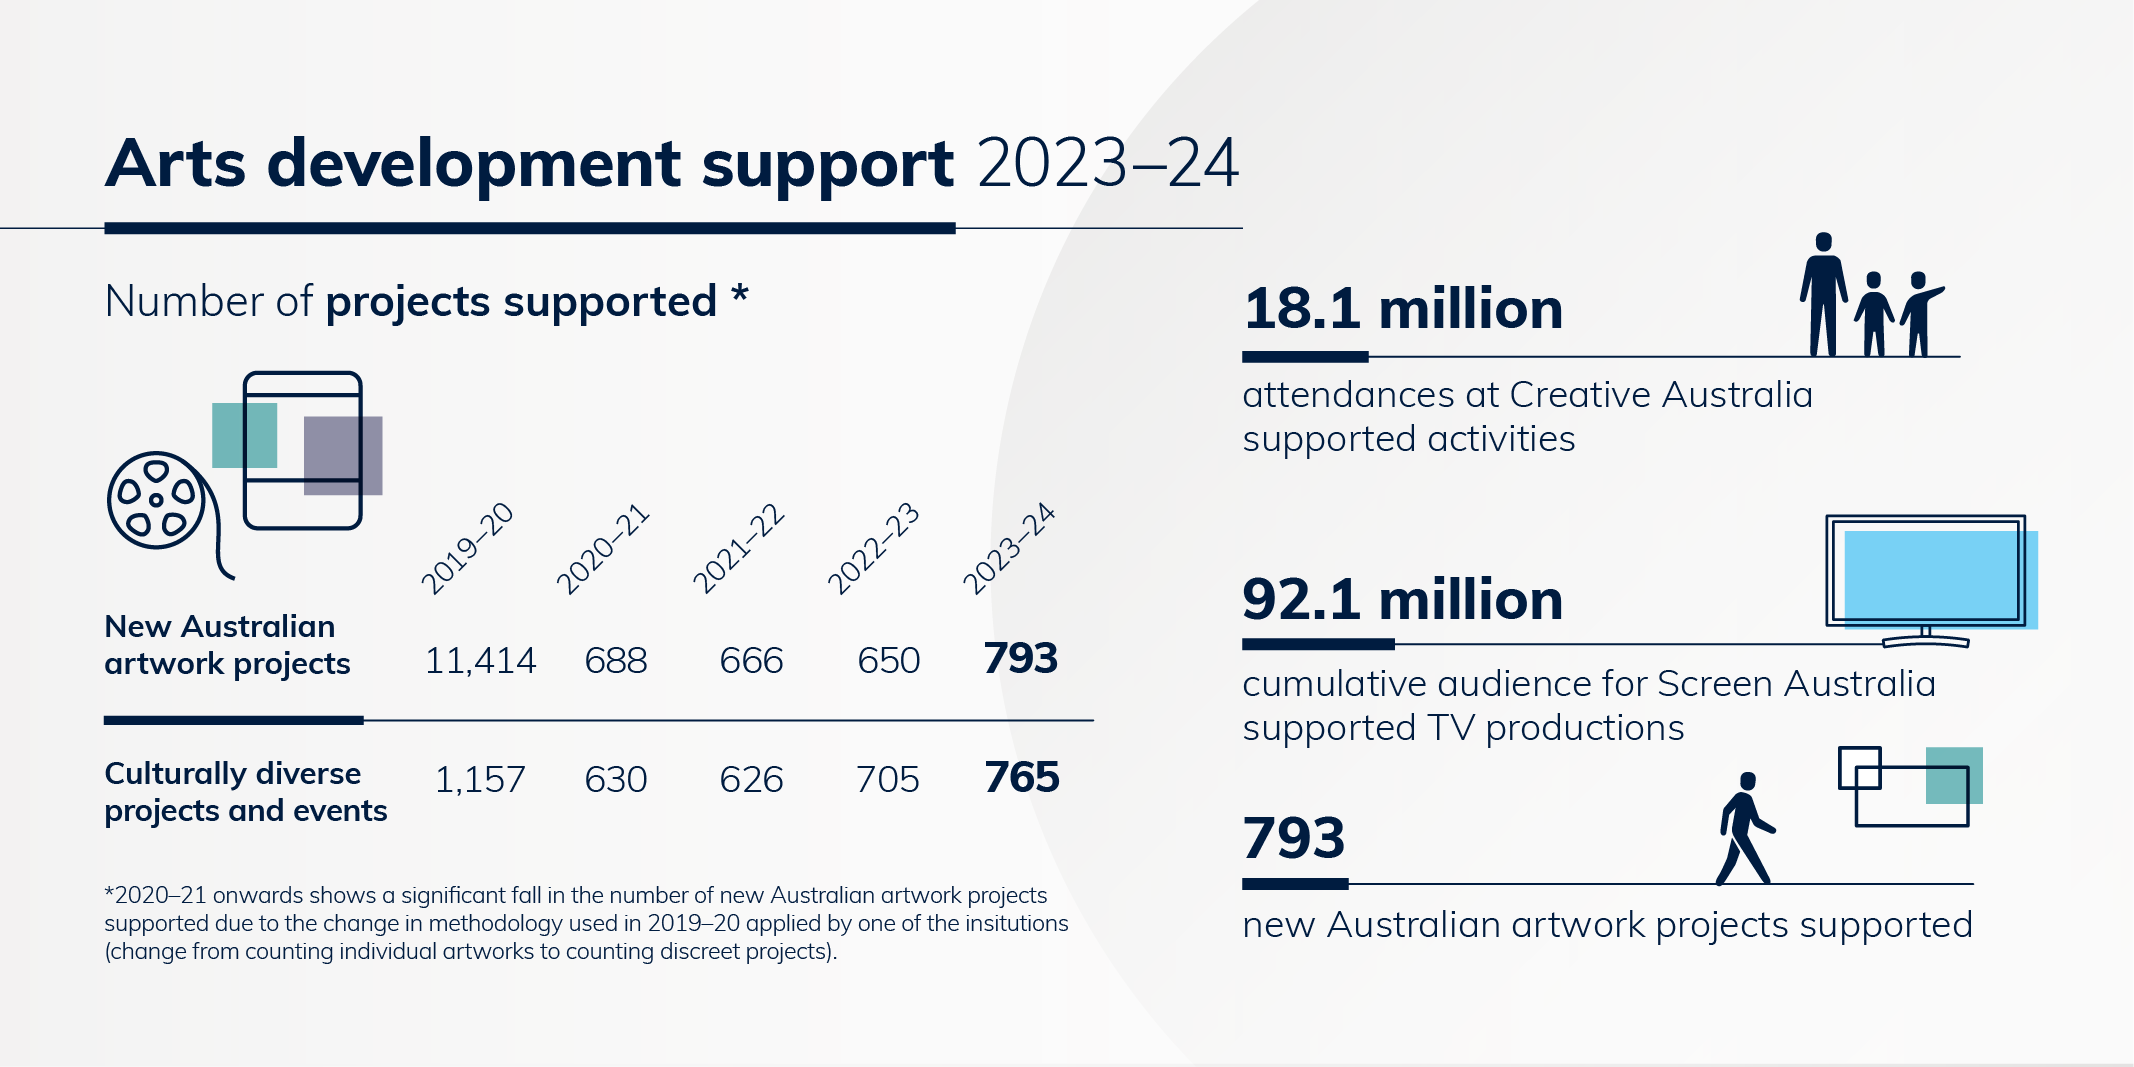
- A line drawing of a film reel and a screen and the text 'Number of projects supported*'. An additional note states '*2020–21 onwards shows a significant fall in number of new Australian artwork projects supported due to the change in methodology used in 2019–20 applied by one of the institutions (change from counting individual artworks to counting discreet projects).'
- 2019–20—11,414 new Australian artwork projects and 1,157 culturally diverse projects and events
- 2020–21—688 new Australian artwork projects and 630 culturally diverse projects and events
- 2021–22—666 new Australian artwork projects and 626 culturally diverse projects and events
- 2022–23—650 new Australian artwork projects and 705 culturally diverse projects and events
- 2023–24—793 new Australian artwork projects and 765 culturally diverse projects and events.
- A line drawing of three figures depicting an adult with two children and the text '18.1 million attendances at Creative Australia supported activities'.
- A line drawing of a TV and the text '92.1 million cumulative audience for Screen Australia supported TV productions'.
- A line drawing of a figure walking up to an artwork and text '793 new Australian artworks supported.
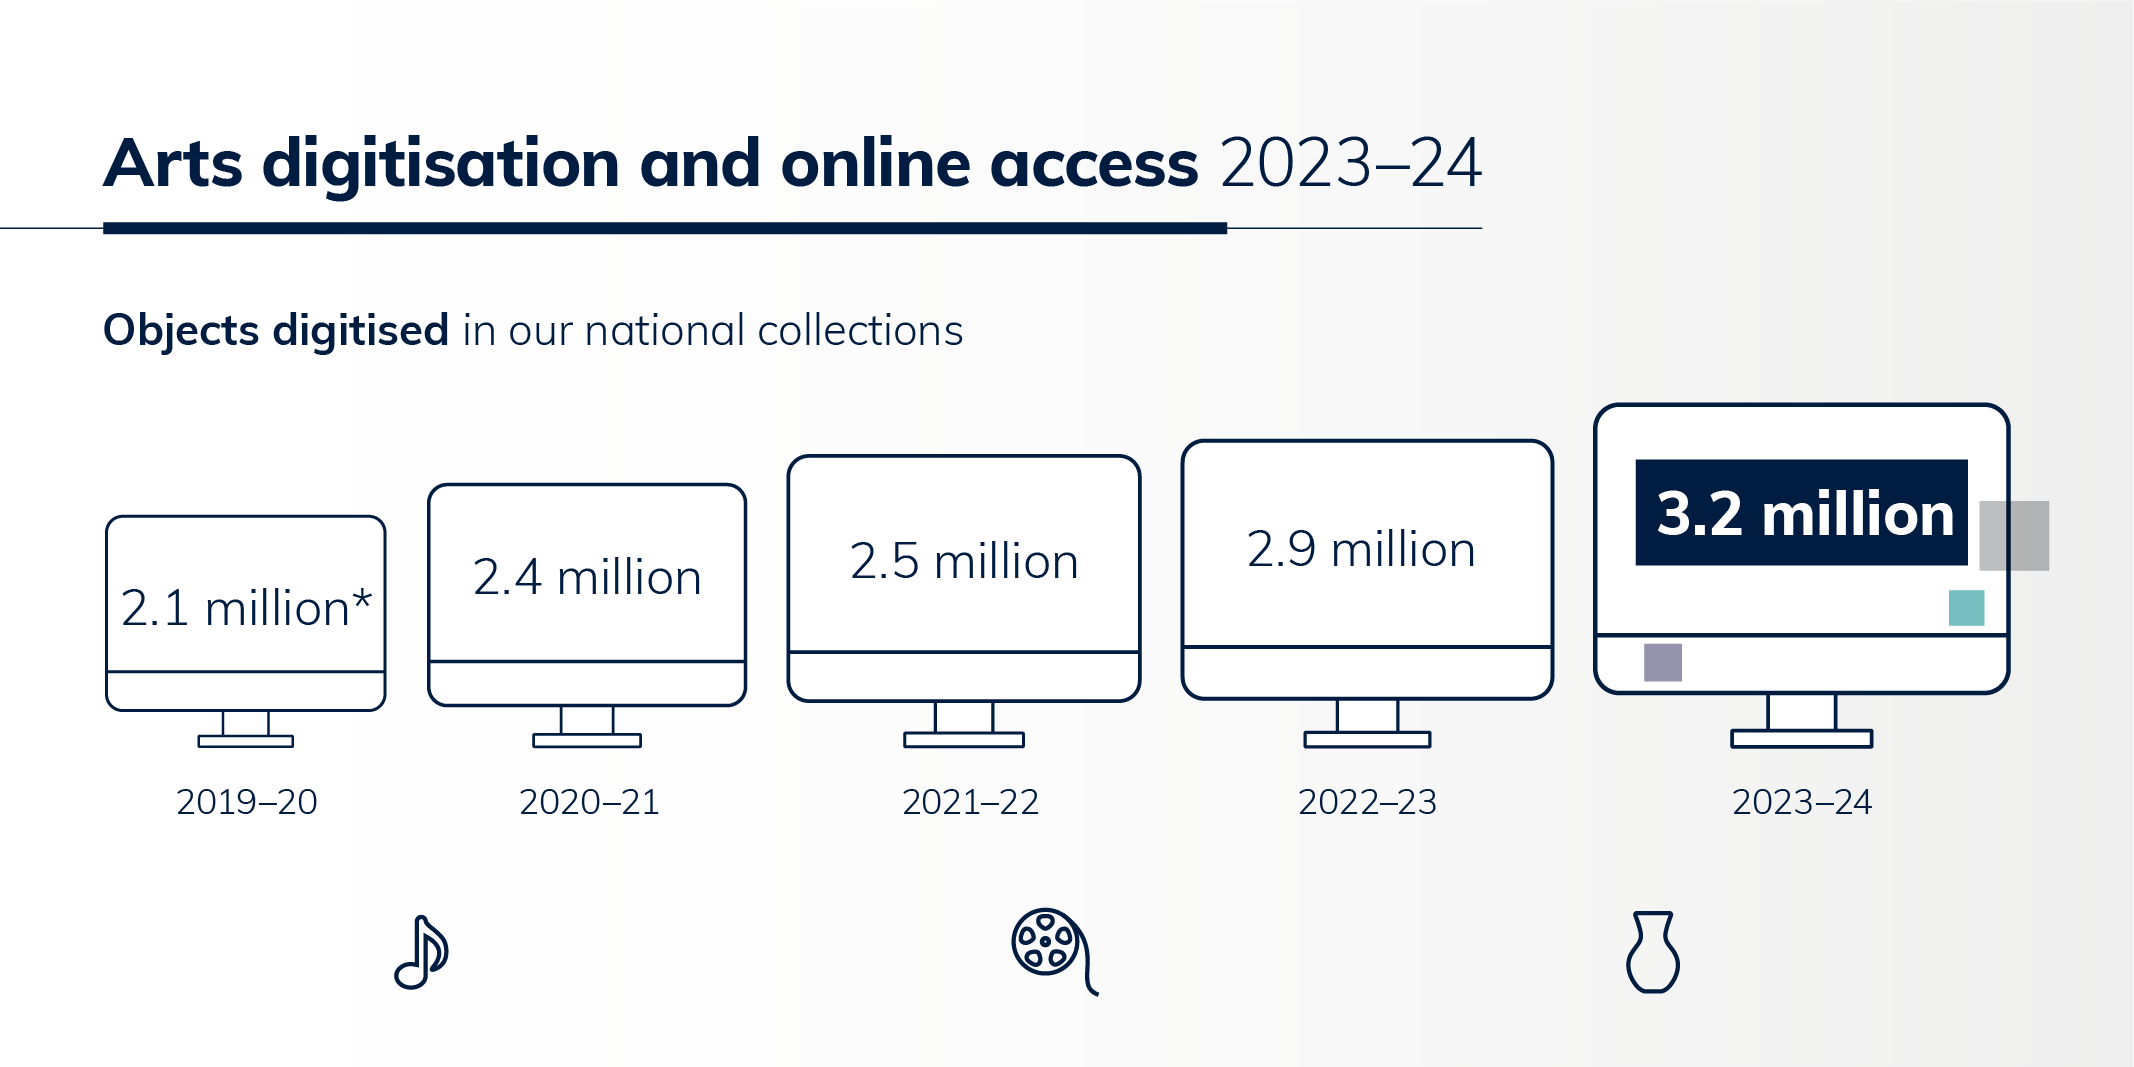
- Line drawings of five computer screens increasing in size, representing the number of objects digitised in our national collections annually over five years
- 2019–20—2.1 million
- 2020–21—2.4 million
- 2021–22—2.5 million
- 2022–23—2.9 million
- 2023–24—3.2 million.
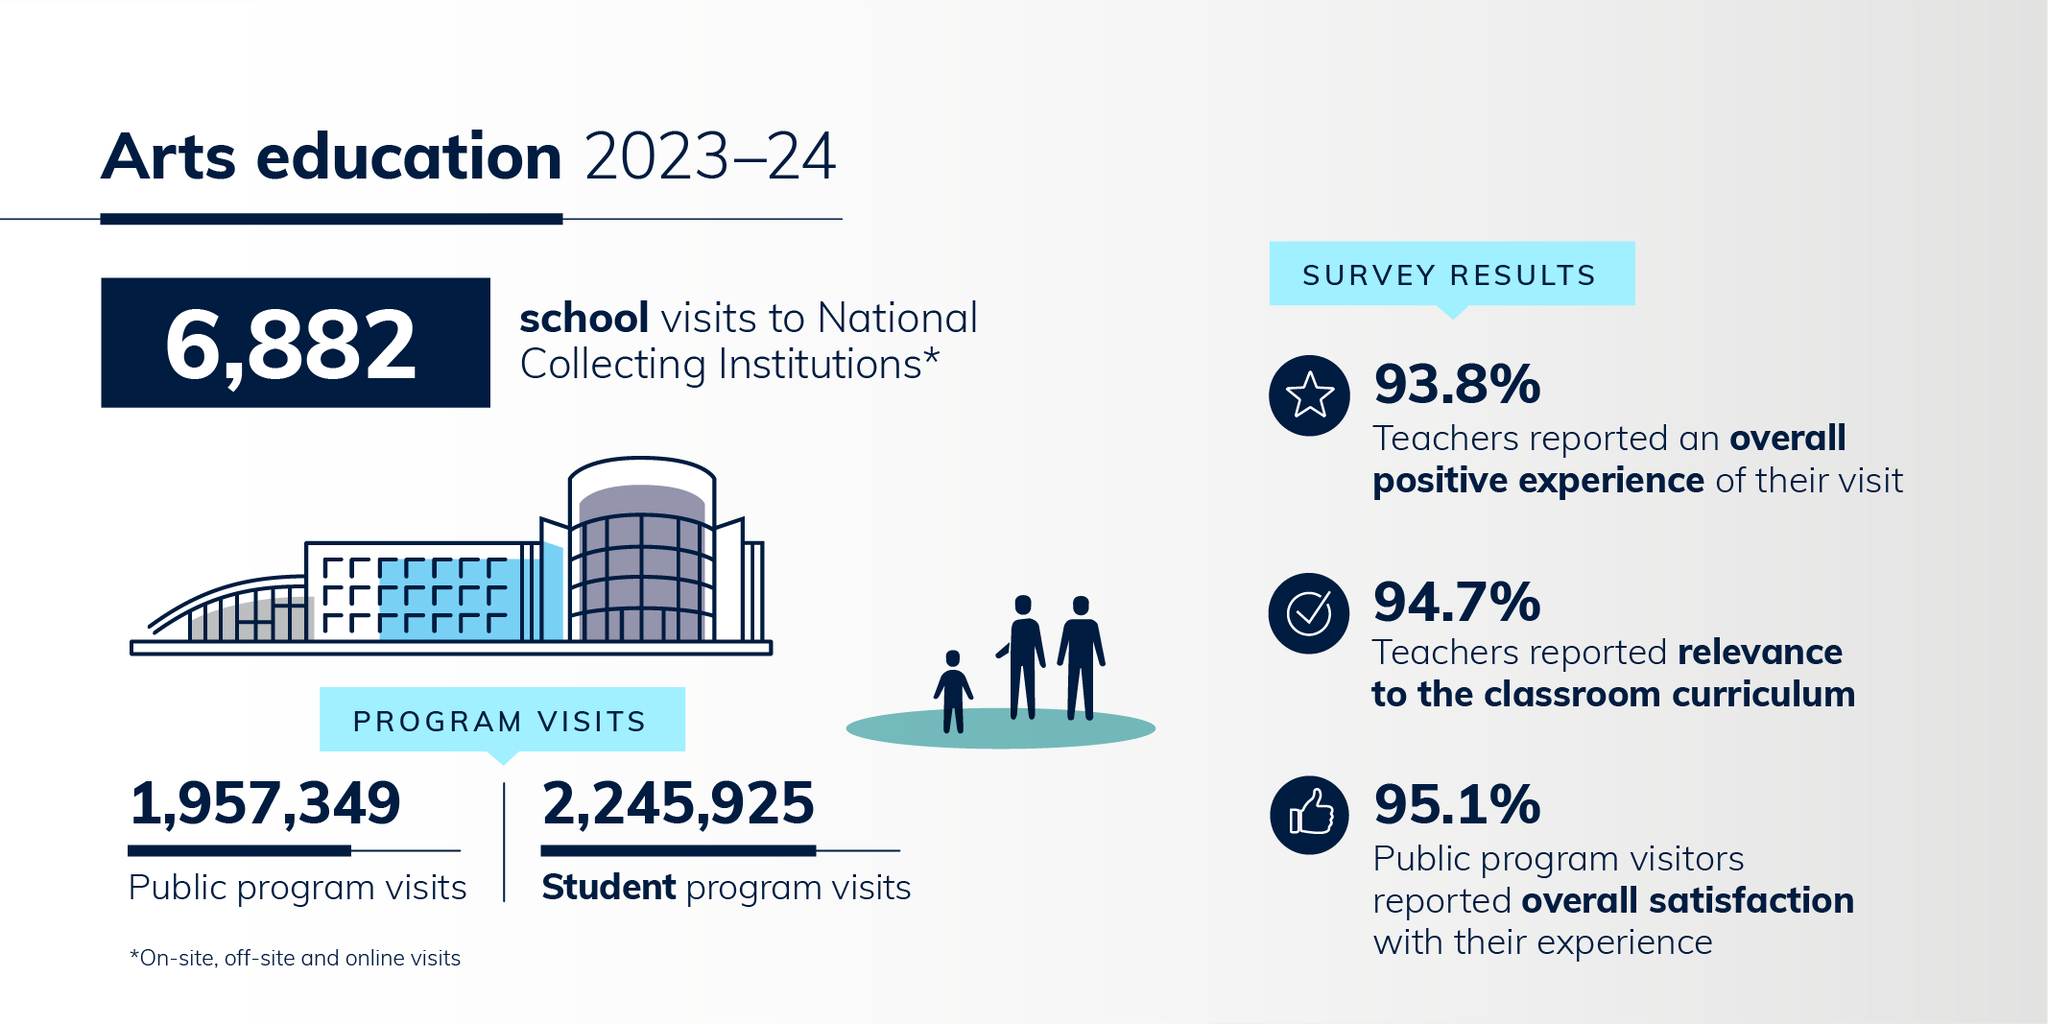
- A line drawing of a generic building is accompanied with the text, '6,882 school visits to the National Collecting Institutions'. School visits include on-site, off-site and online visits.
- Program visits line graphic depicting
- 1,957,349 public program visits
- 2,245,925 student program visits
- A list of Survey Results includes:
- 93.8% teachers reported an overall positive experience of their visit
- 94.7% teachers reported relevance to the classroom curriculum
- 95.1% public program visitors reported overall satisfaction with their experience.
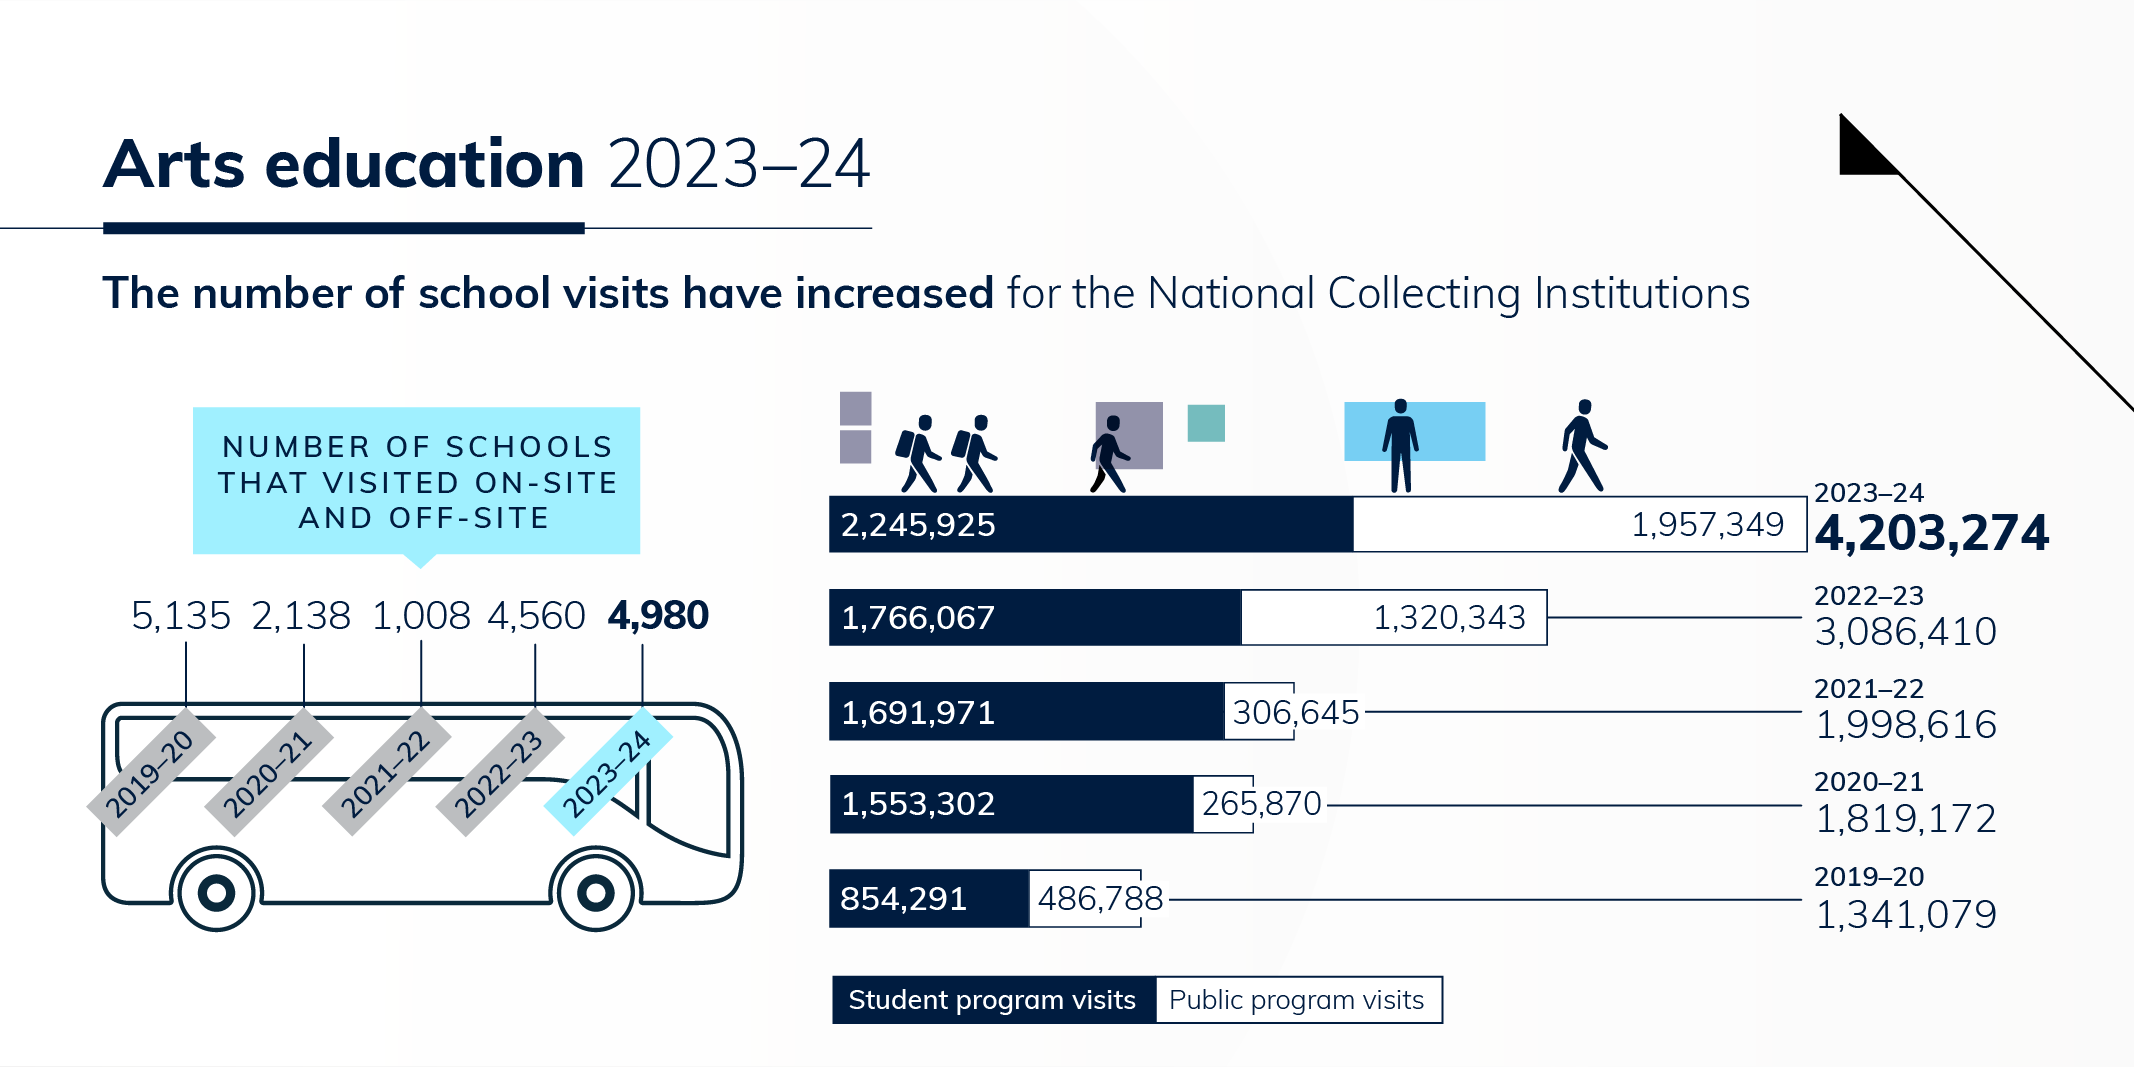
- A line drawing of a bus depicting the annual number of schools that visited on-site and off-site over five years.
- 2019–20—5,135
- 2020–21—2,138
- 2021–22—1,008
- 2022–23—4,560
- 2023–24—4,980.
- A bar graph depicts the annual proportion of student and public program visits over five years.
- 2023–24—4,203,274 total visits comprising 2,245,925 student program visits, and 1,957,349 public program visits.
- 2022–23—3,086,410 total visits comprising 1,766,067 student program visits and 1,320,343 public program visits
- 2021–22—1,998,616 total visits comprising 1,691,971 student program visits and 306,645 public program visits
- 2020–21—1,819,172 total visits comprising 1,553,302 student program visits and 265,870 public program visits
- 2019–20—1,341,079 total visits comprising 854,291 student program visits and 486,788 public program visits.
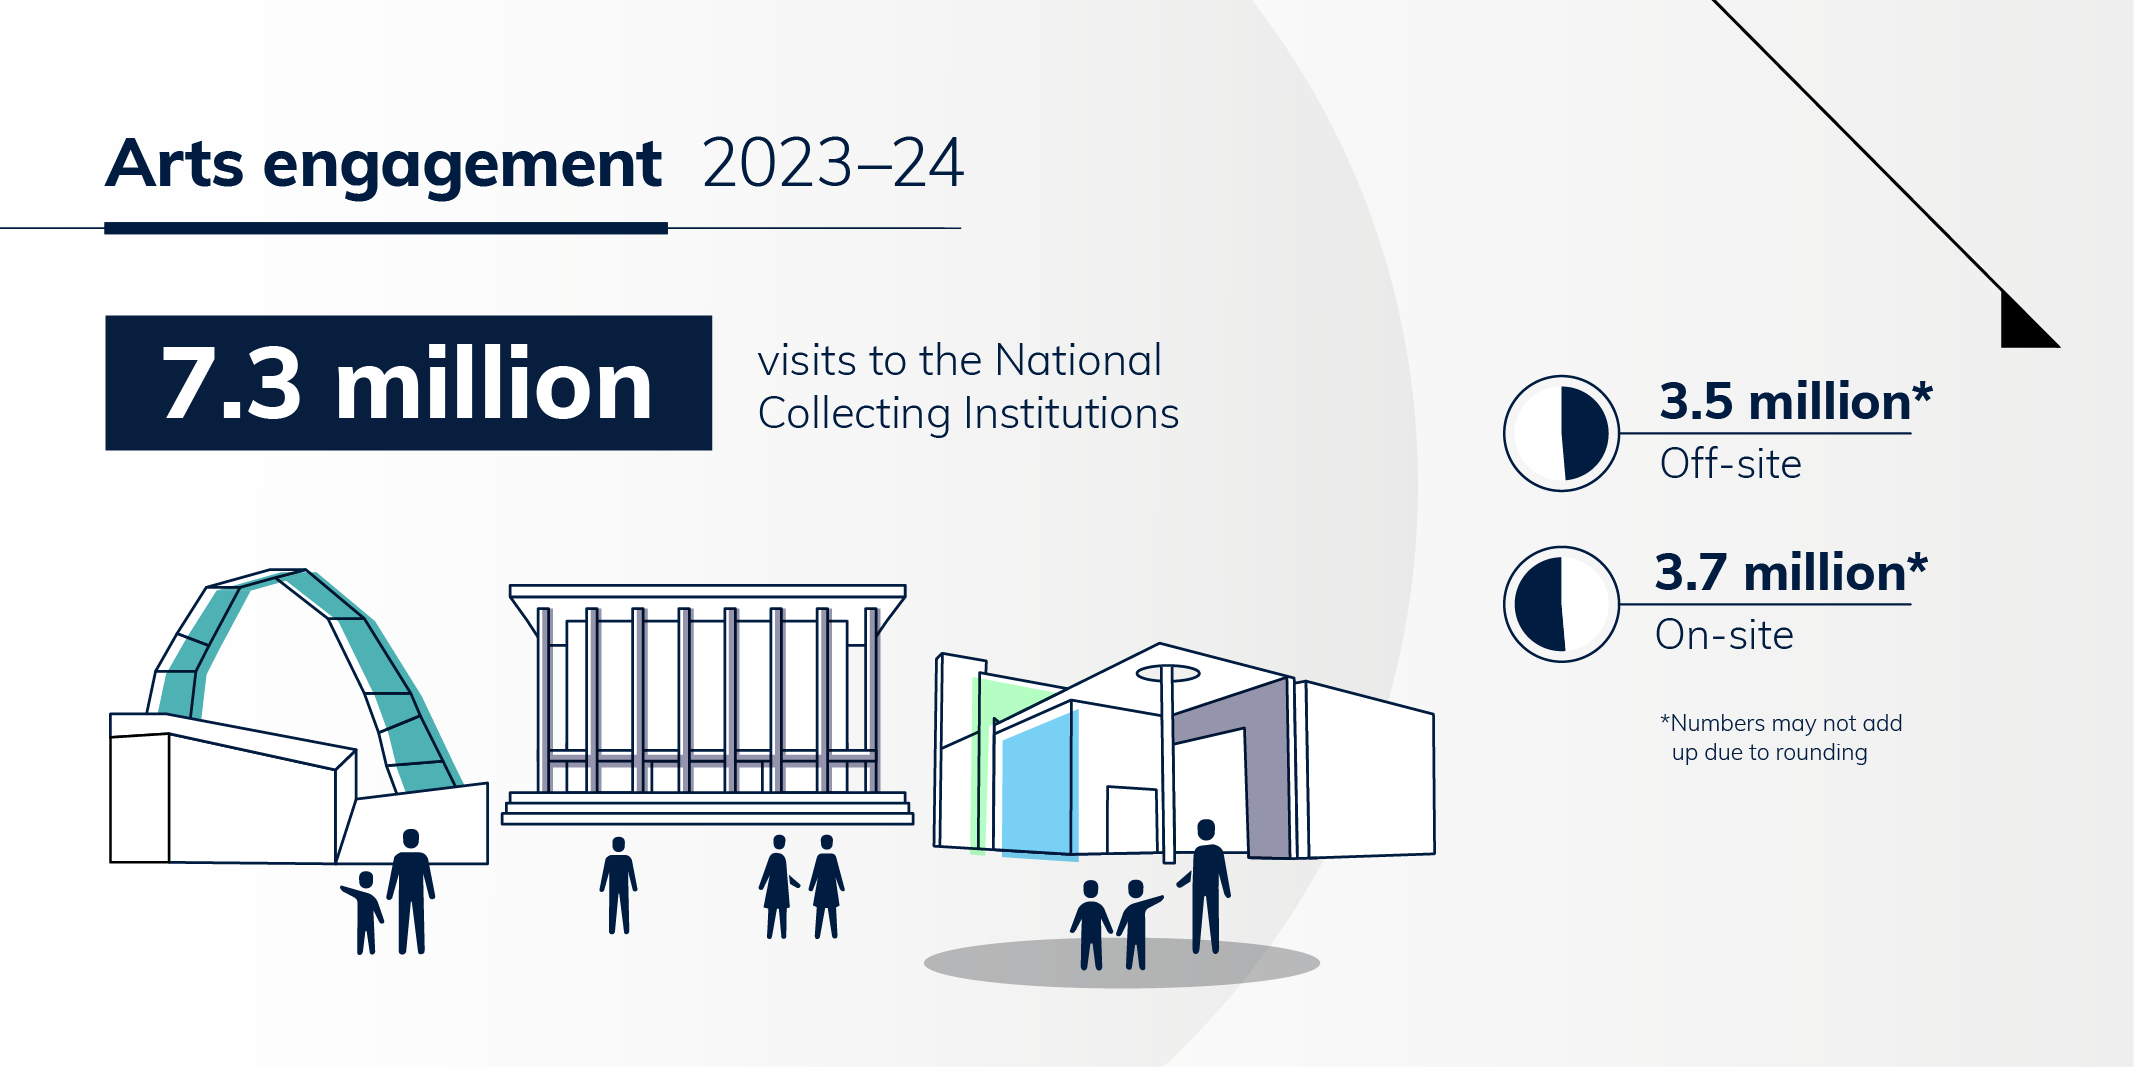
- Line drawing of people outside of the National Museum of Australia, National Library of Australia and the National Gallery of Australia. Text accompanying Image reads, '7.3 million visits to the National Collecting Institutions'.
- Two pie charts are used to provide the proportion of off-site and on-site visits. Pie charts depict:
- 3.5 million off-site
- 3.7 million on-site.
The referenced media source is missing and needs to be re-embedded.
- A line graph of annual on-site, off-site and total visitor numbers over five years and the text 'Onsite visitor numbers to National Collecting Institutions begin to recover from COVID-19.'
- 2019–20—11.6 million total visits, 3.3 million on-site visits, 8.3 million off-site visits
- 2020–21—7.6 million total visits, 2.6 million on-site visits, 5.0 million off-site visits
- 2021–22—5.3 million total visits, 2.0 million on-site visits, 3.3 million off-site visits
- 2022–23—7.9 million total visits, 3.8 million on-site visits, 4.1 million off-site visits
- 2023–24—7.3 million total visits, 3.7 million on-site visits, 3.5 million off-site visits.
- A line graph of annual visits to the National Cultural Institutions' websites over five years.
- 2019–20—47.3 million
- 2020–21—43.1 million
- 2021–22—41.8 million
- 2022–23—34.8 million
- 2023–24—37.7 million.
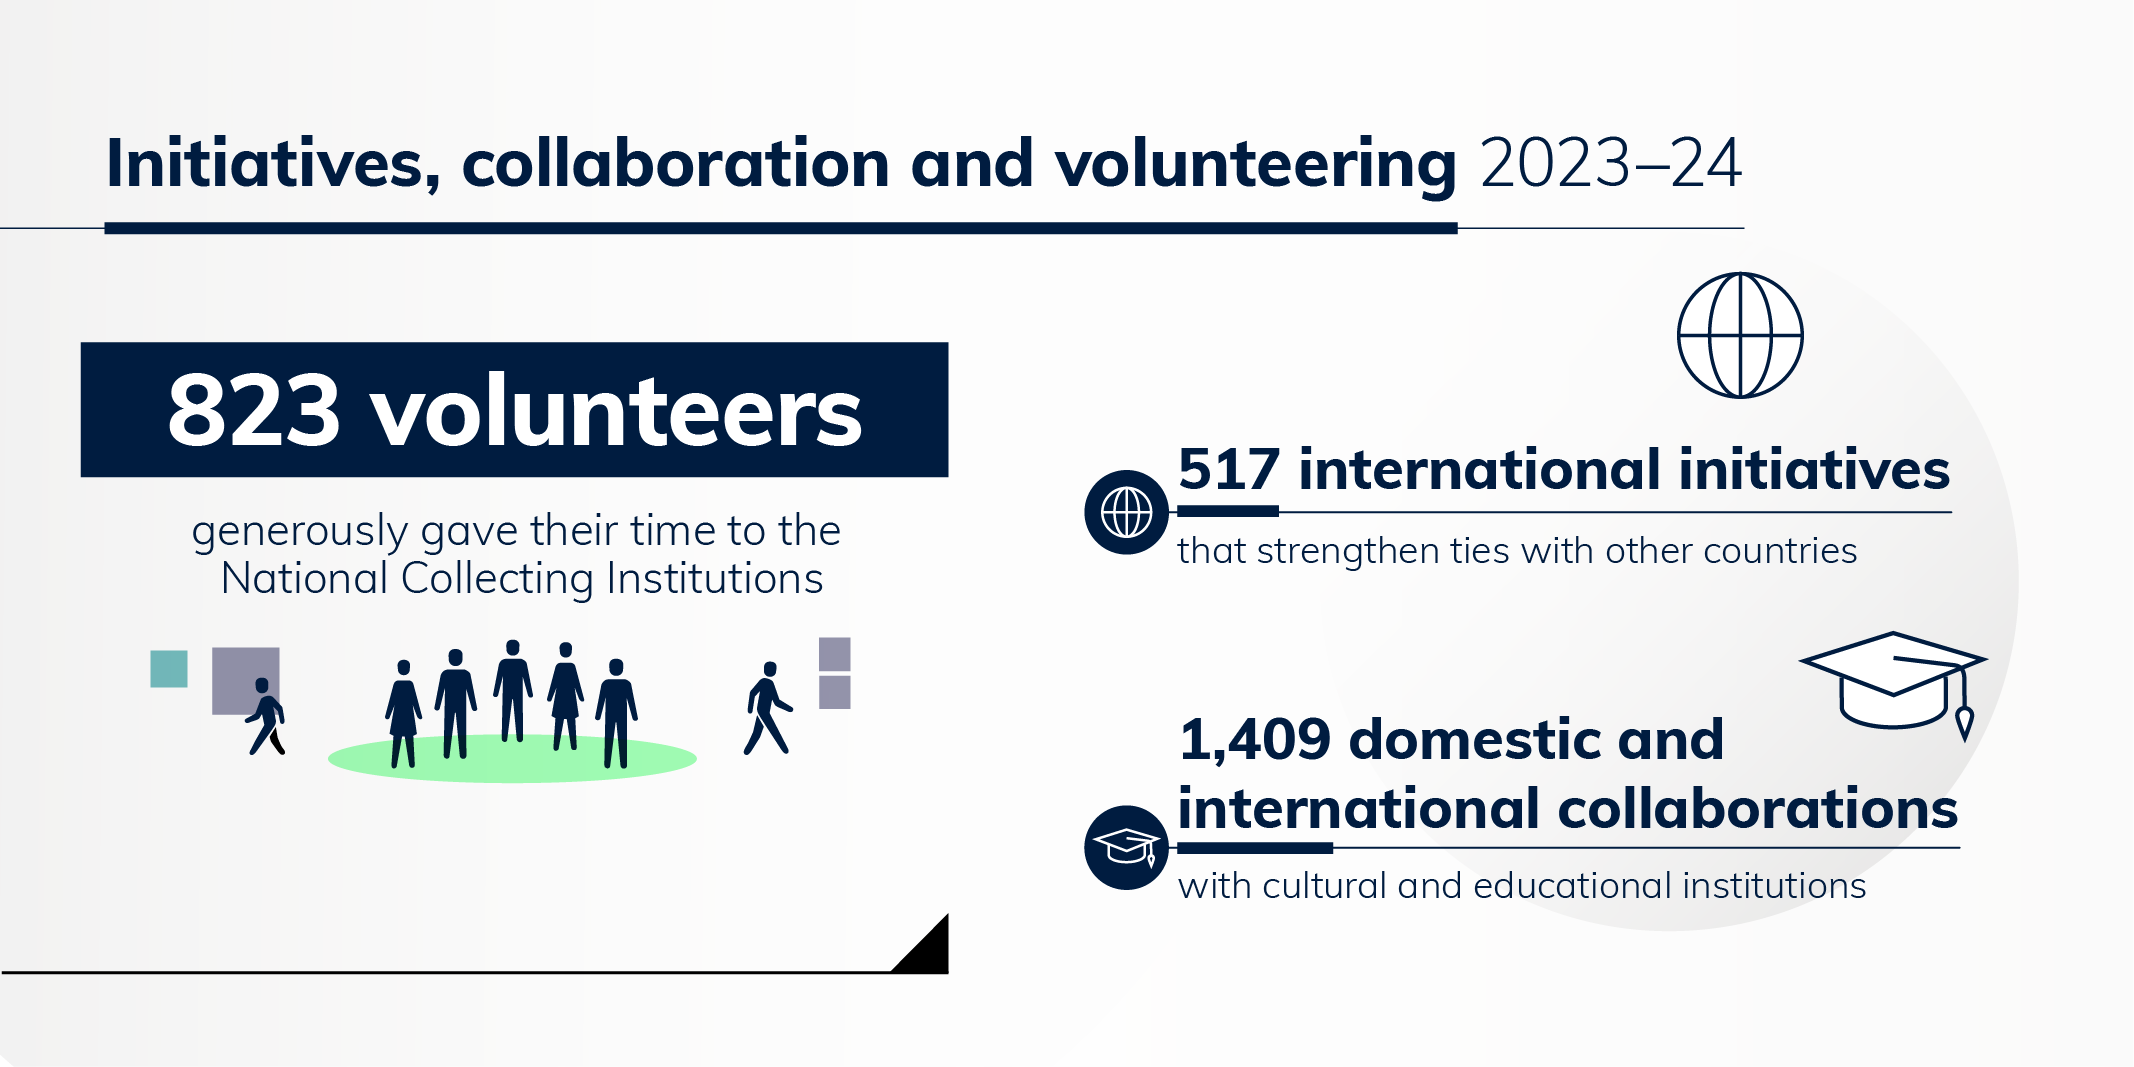
- Line drawing of seven people with the text '823 volunteers generously gave their time to the National Collecting Institutions'.
- Line drawing of a globe with the text '517 international initiatives that strengthen ties with other countries.'.
- Line drawing of a mortar board with the text '1,409 domestic and international collaborations with cultural and educational institutions.'